View statistics
Lowest, average and highest grades, grade distribution and success per question or per tag.
Written By Florian Barral
Last updated 9 days ago
The statistics show the distribution of grades and the success on each question. They help you spot a question that is too hard, or a mistake in the right answer.
Open the statistics
Open the Results step, Statistics tab. You will find:
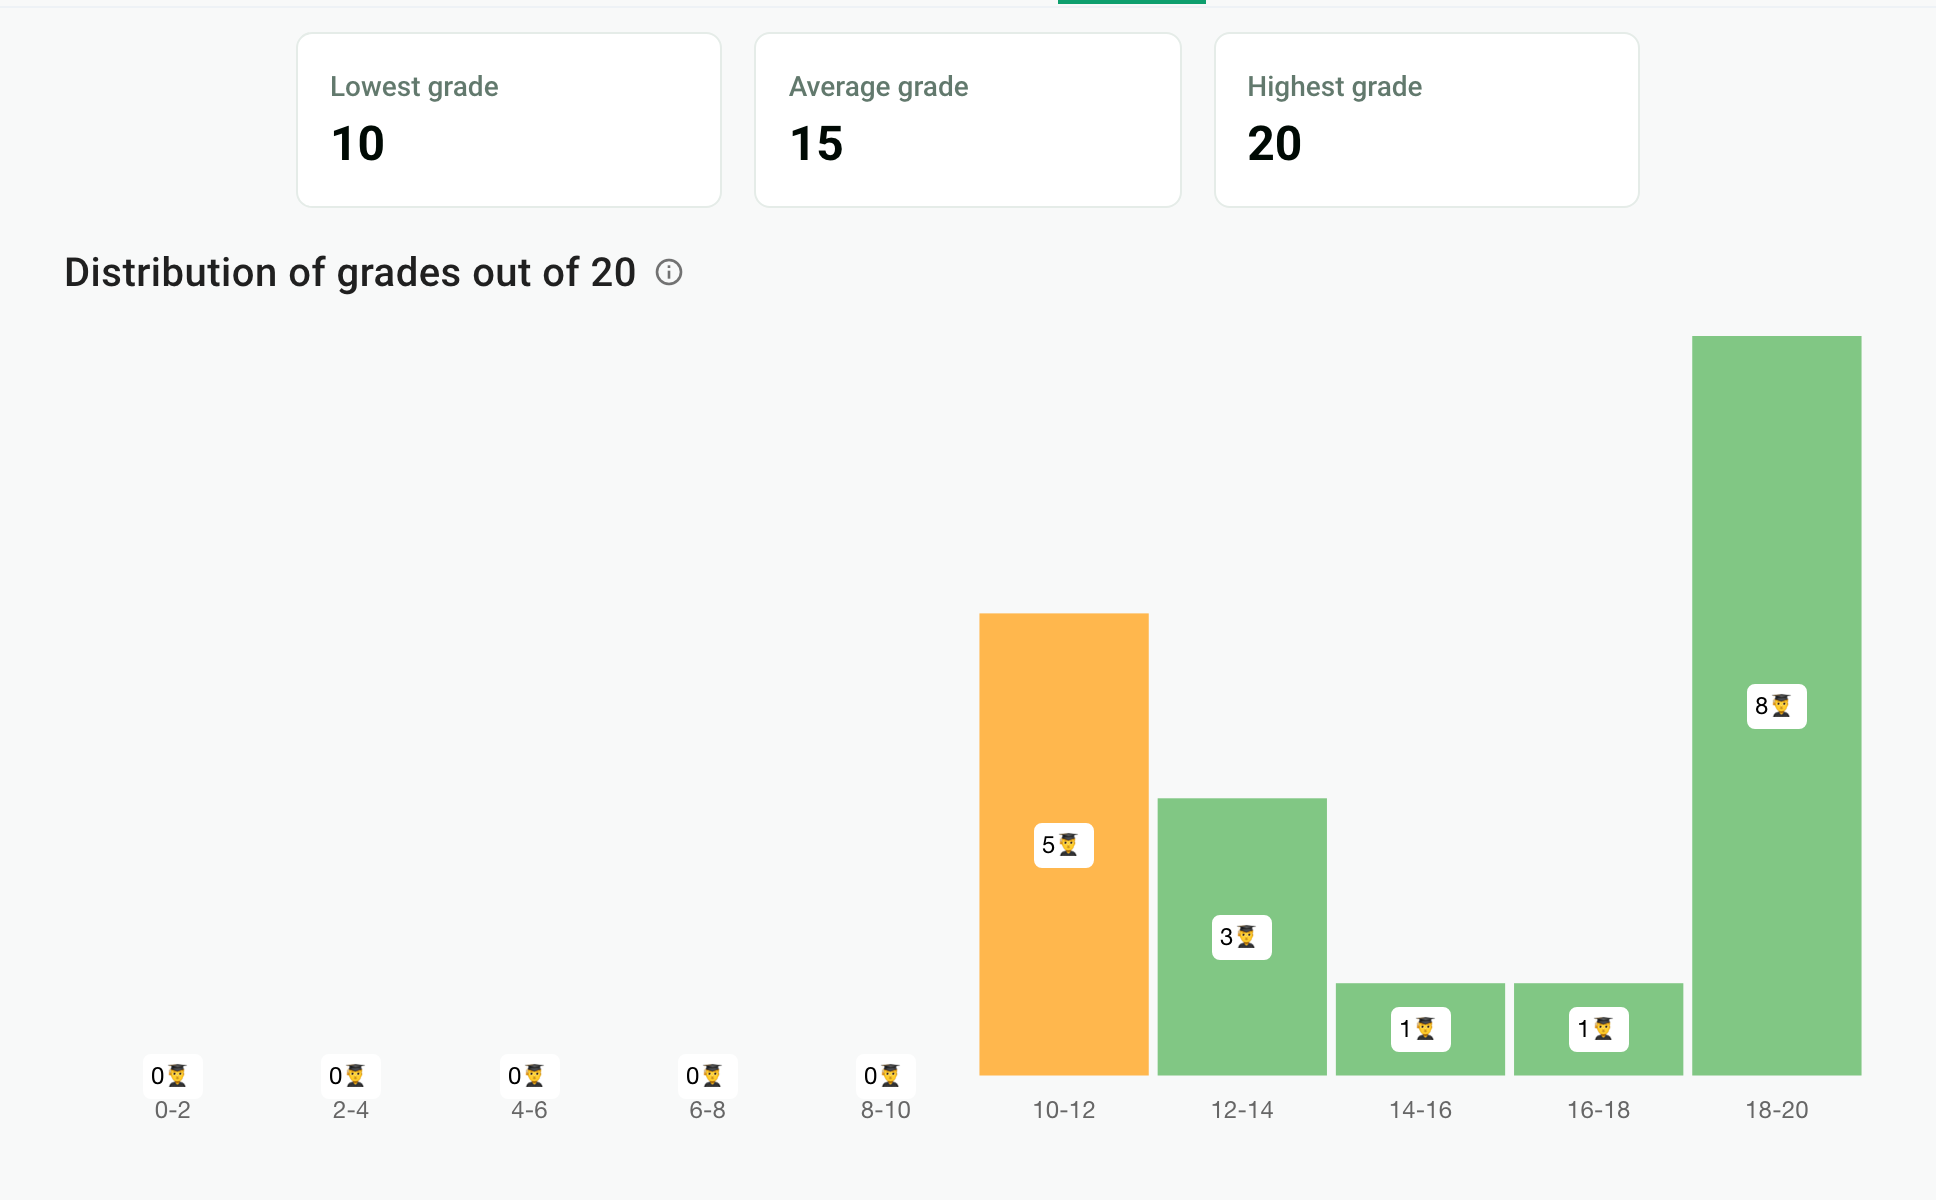
the Lowest grade, the Average grade and the Highest grade, rounded to the nearest whole number;
the Distribution of grades: the number of participants per grade range, on the exam's grading scale.
Success question by question
Under the chart, the table lists the questions with:
Answers: the number of answers to the question. A question drawn from a pool only appears on some of the copies.
100% correct answer rate: the share of answers that earned all the question's points, in red below 40%, in orange below 60%, in green above.
Tags: the question's tags.
Click a question to see, for each choice, how many participants checked it. Show answers reveals the right answers; Previous and Next (or the keyboard arrows) move from one question to another.
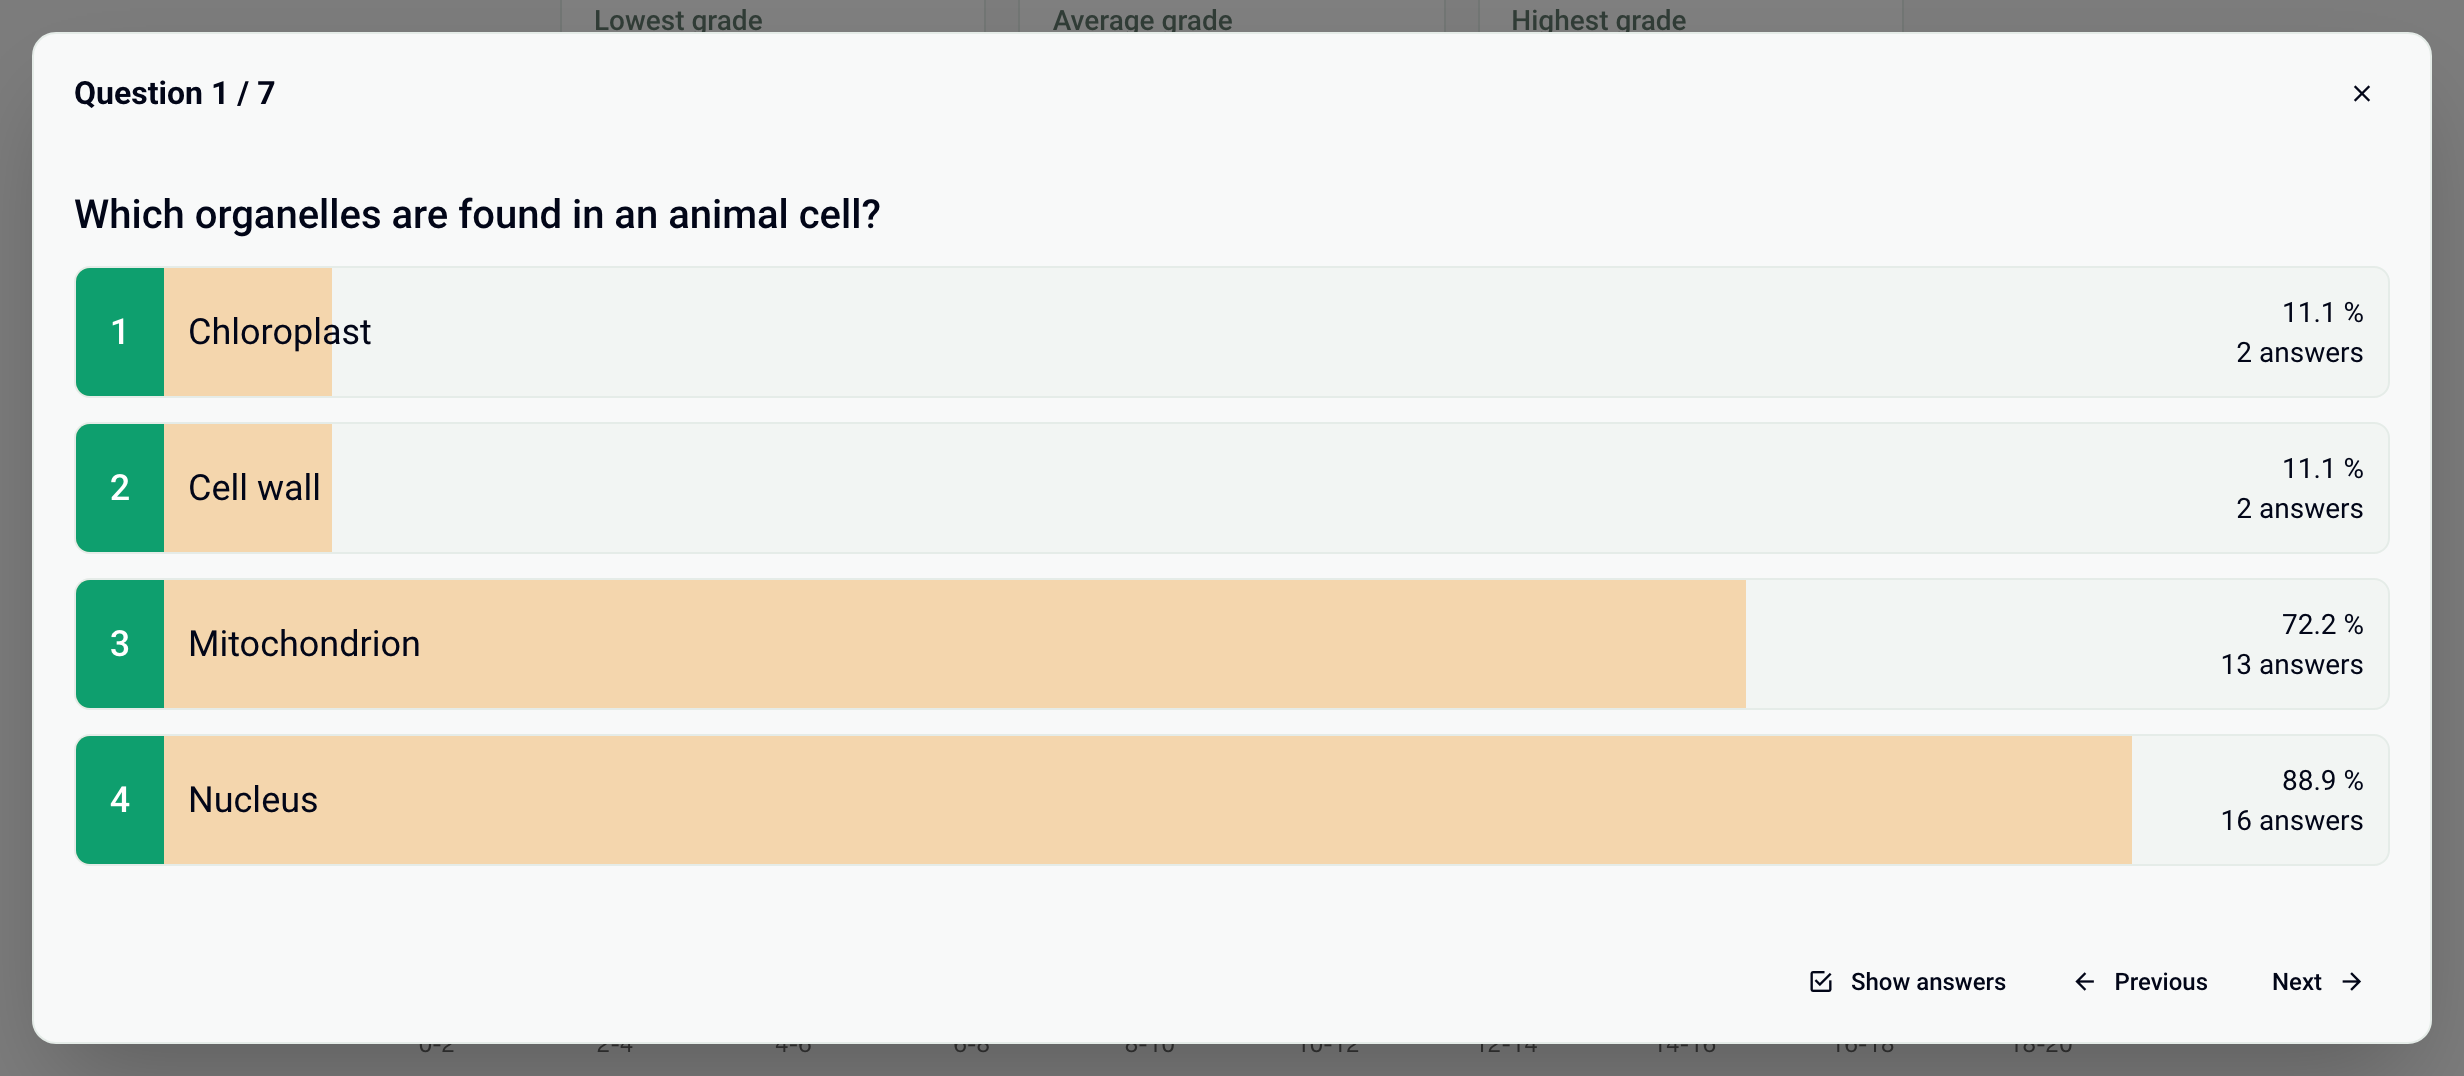
A wrong choice checked by almost everyone, or a very low success rate, often points to a mistake in the answer key. To fix it and recalculate the grades, see Fix the subject and recalculate grades.
Statistics per tag
If your questions have tags (a chapter, a skill, a difficulty level…), click Filter by tags above the table and choose one or more tags: the table keeps only the questions that carry at least one of those tags. This lets you compare success from one chapter to another.

To get a grade per tag for each participant, export the Detailed grades per tag: see Export grades.
Project the statistics
The statistics show no participant names: you can project them in class to go back over the least successful questions.
Frequently asked questions
The average grade shows 0
The average grade shows 0
First open the Grades tab, then come back to Statistics: the lowest, average and highest grades then display correctly.
The Tags column is empty
The Tags column is empty
No tag is set on the questions. Add them in the Create step, on each question: the statistics take them into account right away.
Was this helpful?
Still need help? Ask the team